As Canadian author Danielle LaPorte says, “You don’t need to be burned out to go on hiatus.” Where I’ve been doesn’t matter. What matters is where we’re going.
Game of Thrones took 595 days between Season 7’s 2017 Finale and Season 8’s April 2019 premiere. I’ve been gone since January. I’m sure you’ve been fine.
YTD, I’m down somewhere in the neighborhood of @^$*! %. It’s not great. But there’s no crying in baseball.
Instead, let’s focus on learning, growing and getting better.
In January, I expressed that my journey with Snap (yes, the camera company) needed a post-mortem.

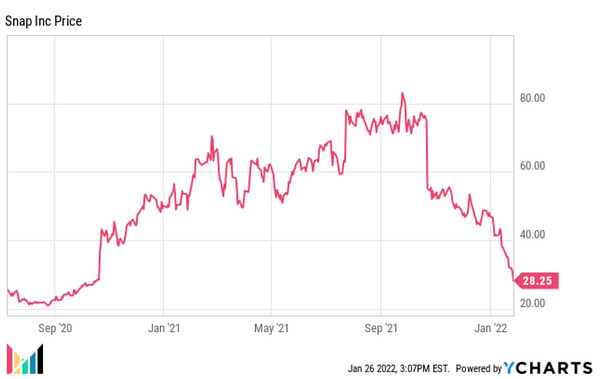
I didn’t think I was actually going to do it. But by definition, hiatuses must come to an end. So nine months later, here we are.
Looking back, it’s not like the signs weren’t there.
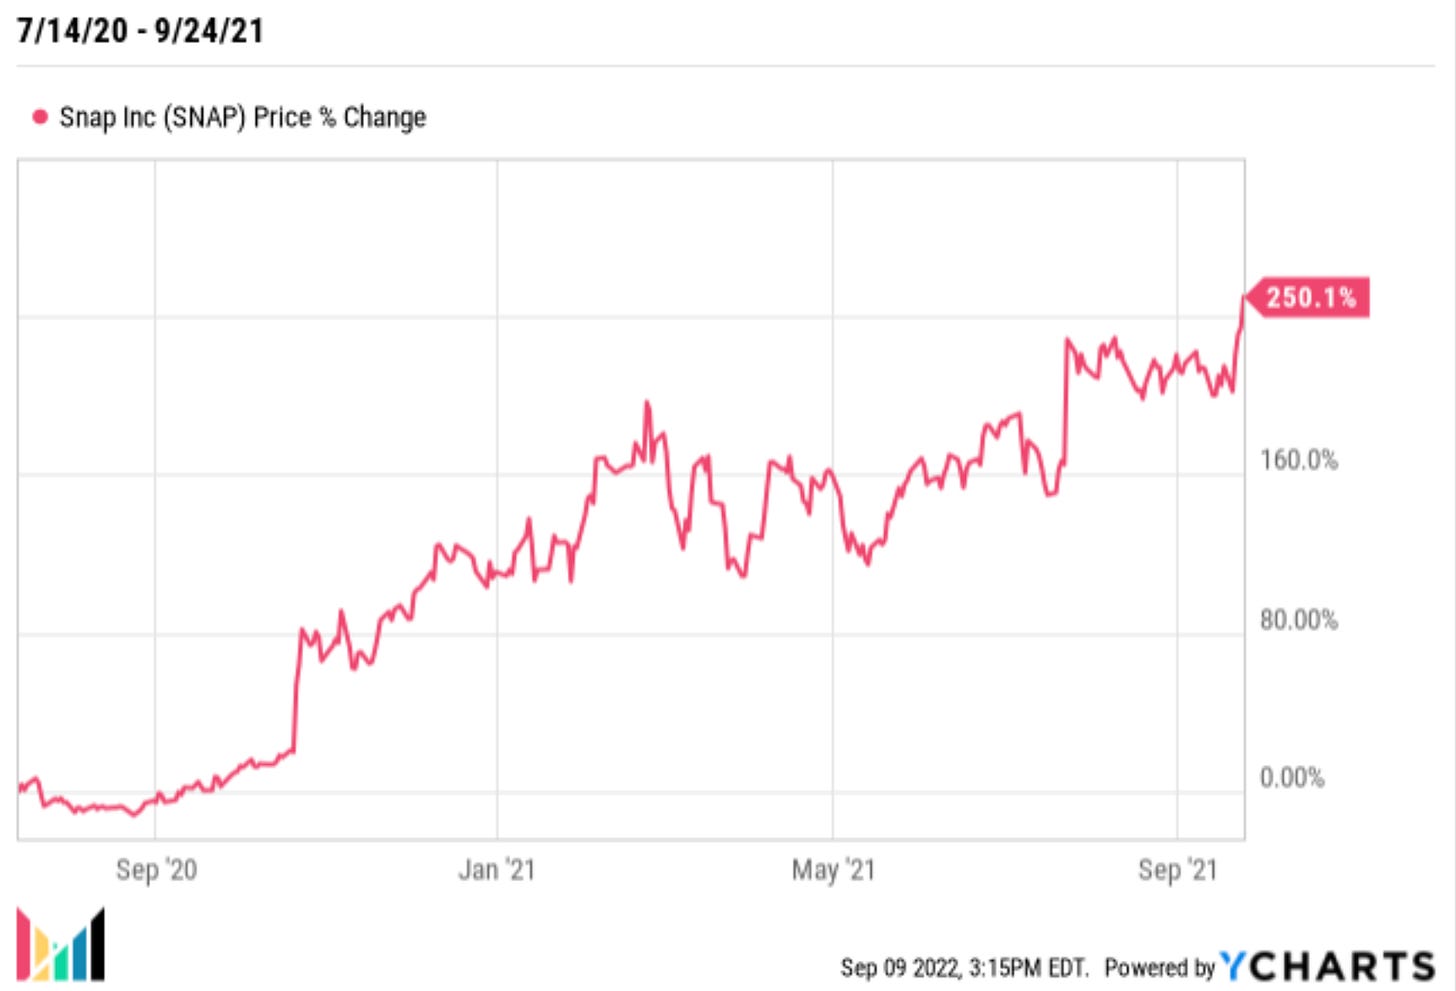
Snap up 800% in 18 months? C’mon, stop.


How many years were The Trade Desk and Shopify going to go up triple digits? Infinity years?
Snap was the very first Deep Dive I wrote about on this platform. (I know, where does the time go!)
Gosh, I don’t even want to quote what I wrote because it’s making me nauseous thinking about it, but in my service to you, dear reader, here goes:
[Snap] isn’t a bet on fundamentals. I’m hesitant to even look at other, more traditional metrics. They just don’t feel relevant. This is a bet on the future. I promise the fundamentals of Amazon and Netflix didn’t look amazing ten years ago.
Can you imagine if I presented that in a serious pitch to a PM? Yea, me neither.
But, it didn’t actually matter. From the time I hit the big scary publish button, I was a genius. It kept rolling.
But, since that high water mark, Snap is down just *checks notes* 86%. Whoops.
The lessons here are many. But there is one huge one:
Don’t get blown up.
Again, for those in the back, DON’T GET BLOWN UP.
Look, every single one of us is on a unique investing journey. We’re investing personally or professionally (or both). We’re investing large or small amounts of capital (YMMV). We have short or long-term time horizons. We’re in it for capital growth or preservation. Our variables are unique and personal. We should never assume we know what’s best for other people, and not pass judgements on the decisions of others.
But we all can agree that getting blown up is not an ideal strategy. I think of this tweet from MBI all the time, and should have been thinking about it more.

Hit for average, not for power.
These triple digit growth bombs may make for a great year or two. But they are risky.
Not to pick on anybody, but this is the gist of what we’re talking about:
Slow and steady wins the race.
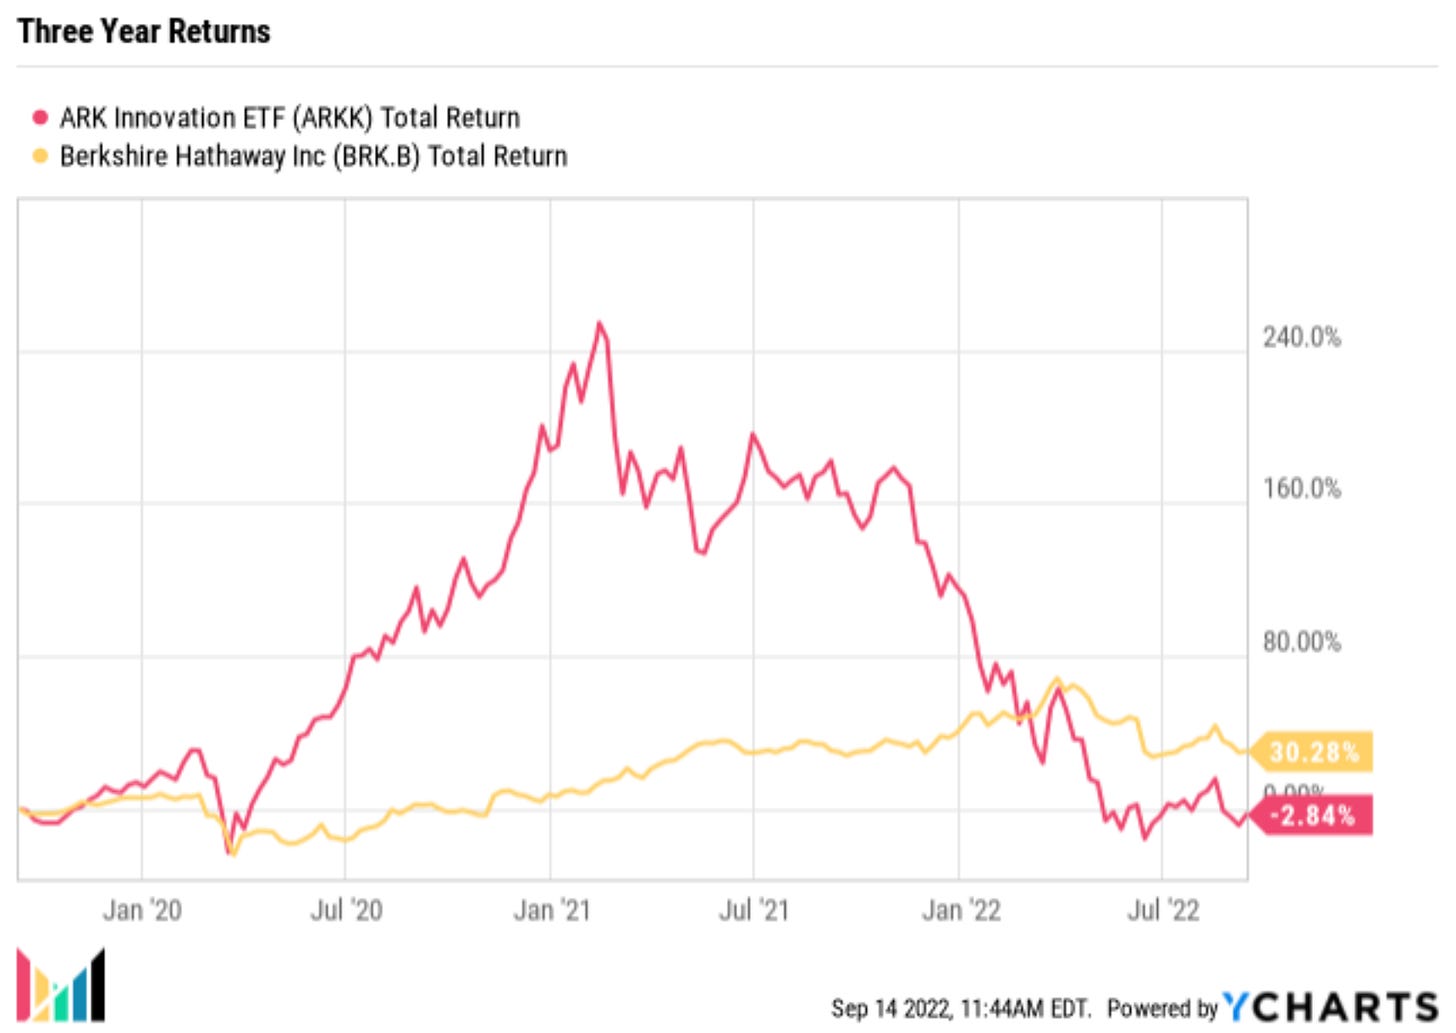
If your risk appetite is large, go nuts. You may ride an incredible wave. But remember the data. Remember waves move in multiple directions. Just three 50% down years cripple your long-term, 30 year portfolio.
So where does that get us?
I’m embarrassed that many of my positions have not been free cash flow positive. Want to take a stab on free cash flow negative companies every now and then? Go for it. I did, riding 2020 waves up, but also 2021 waves down.
I’m no Venture Capitalist. I’m no Angel Investor. As a public markets investor, I don’t need to wait or hope or predict when companies might turn free cash flow positive. There are plenty of them already! And as Jonathan Larson told us, there’s “no day but today.”
Looking for positive free cash flow per share companies is hardly a contrarian take.


Sure, take a flier on a growth bomb every now and again. Fine. But as a portfolio strategy? No dice. If my goals are to not get blown up, I want to spend more time fishing in the right waters.
Exhibit A: Free Cash Flow Per Share Waters
I took a look at the FCF/Share numbers of all names in the S&P 500. There are just 34 that had growing positive free cash flow each year. Here they are with FCF/Share numbers and Y/Y growth rates.
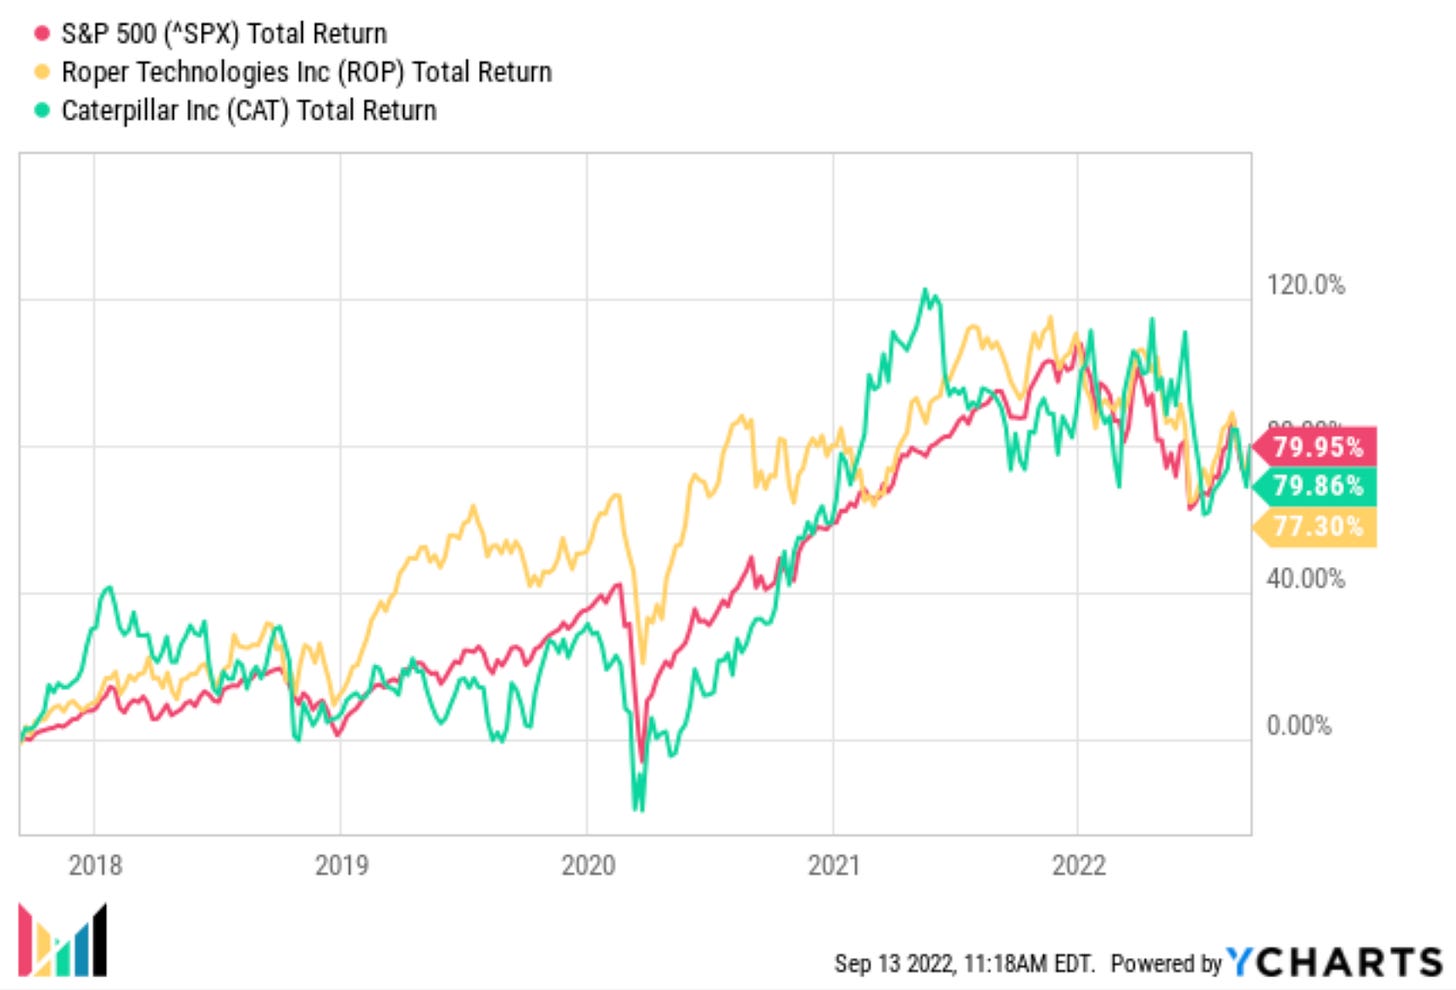
Keep in mind that over the last five years, the S&P has total returns of 79.95% and annualized returns of 10.49%.
Of the 34 names:
Six underperformed (17.6%).
Two were in line (5.9%).
The remaining 26 outperformed (76.5%) the index. Here they are in three charts, going from least to most meaningful outperformance.
And here are all 34 names organized by total five year returns.
Fun place to go fishing, right?
In that earlier Deep Dive, I touched on Snap’s Free Cash Flow. I said:
If we must look at fundamentals… Free Cash Flow is about to break free into the green:
What a spin! Snap had never actually been free cash flow positive, but the story was clear: it was going in the right direction. And I bought it.
This slide, from Snap’s 2020 April Investor Presentation, was noticeably absent in Snap’s 2021 and 2022 April Investor Presentations. Wonder why.
Instead, we were treated to this slide in 2021:
And this, in 2022:
They did in fact, hit positive free cash flow to end 2021. Huzzah 🍻!
But as Snap issued more and more shares (🚩), to this point, their positive free cash flow per share has topped out at a whopping $0.14.
Here’s to ending hiatuses and not getting blown up. Positive free cash flow per share, here we come. Let’s get it.
~Maz








Good work man!
Welcome back, Maz!